


In this article we gonna have a look at some ways you can measure your site's performance. In order to make our site more performant, we first need to know exactly what we can improve. 👏
Lighthouse 🏘️
Lighthouse is an open-source tool from Google that helps you evaluate the quality of web pages. It has audits for performance, accessibility, progressive web apps, SEO and more.
There are 3 ways you can access it:
Within Chrome's DevTools.
As the online web.dev or PageSpeed Insights tools.
As a Node.js module, through which command-line and automated tests can be executed.
The easiest way to start is through Chrome's DevTools.
You do want to measure in Incognito mode, that way extensions and other stuff are disabled/gone.
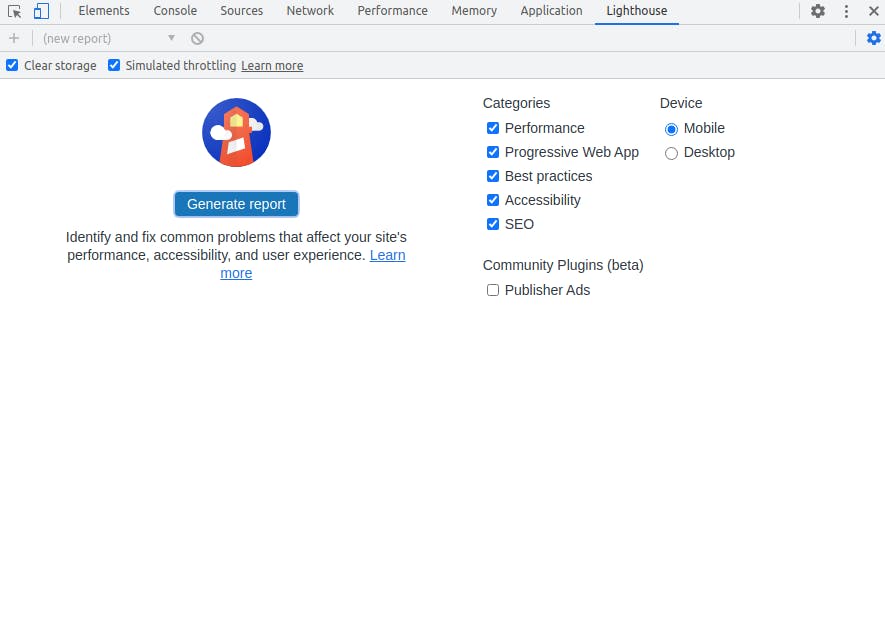
Select the device, categories, make sure to check both Clear storage and Simulated throttling. Clearing the storage is important to ensure there is no influence from browser caching.
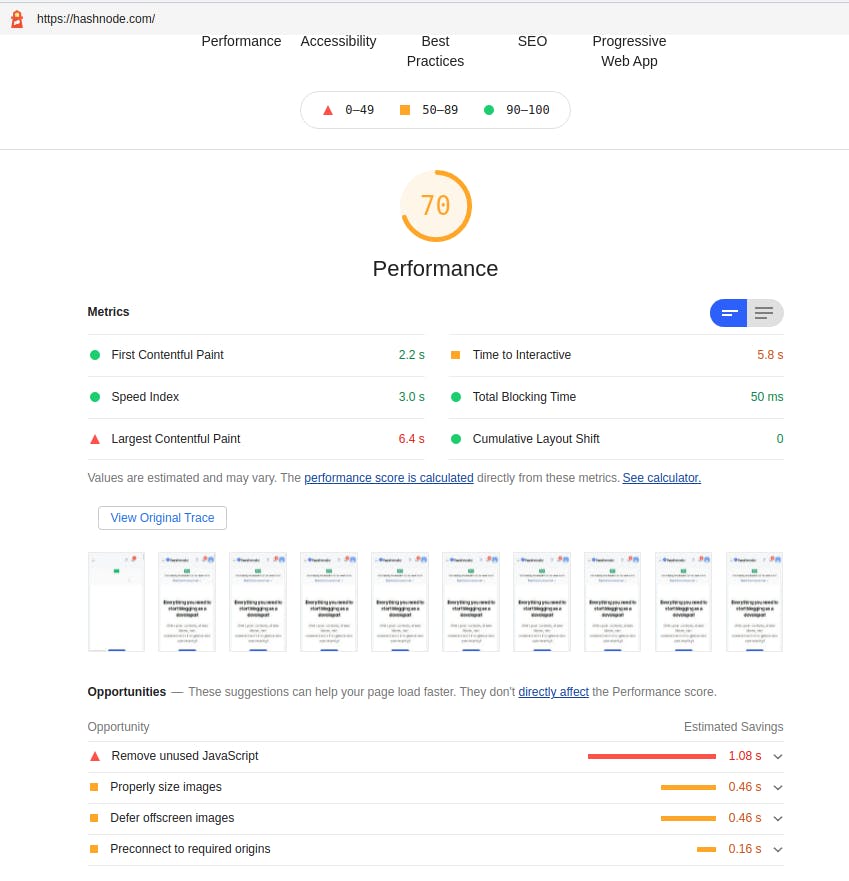
The performance information includes:
First Contentful Paint: The time at which the first text or image is painted.
Speed Index: How quickly the contents of a page are visibly populated.
Largest Contentful Paint: The time at which the largest text or image is painted.
Time to Interactive: The amount of time it takes for the page to become fully interactive.
Total Blocking Time: Sum of all time periods between FCP and Time to Interactive, when task length exceeded 50ms, expressed in milliseconds.
Cumulative Layout Shift: The movement of visible elements within the viewport.
There is some more information, but the interesting section is the one after Metrics, Opportunities. It shows suggestions that would speed up the page load.
DevTools Network Panel 📺
The developer tools in modern browsers provide a Network panel that provides information on all network activity during page load.
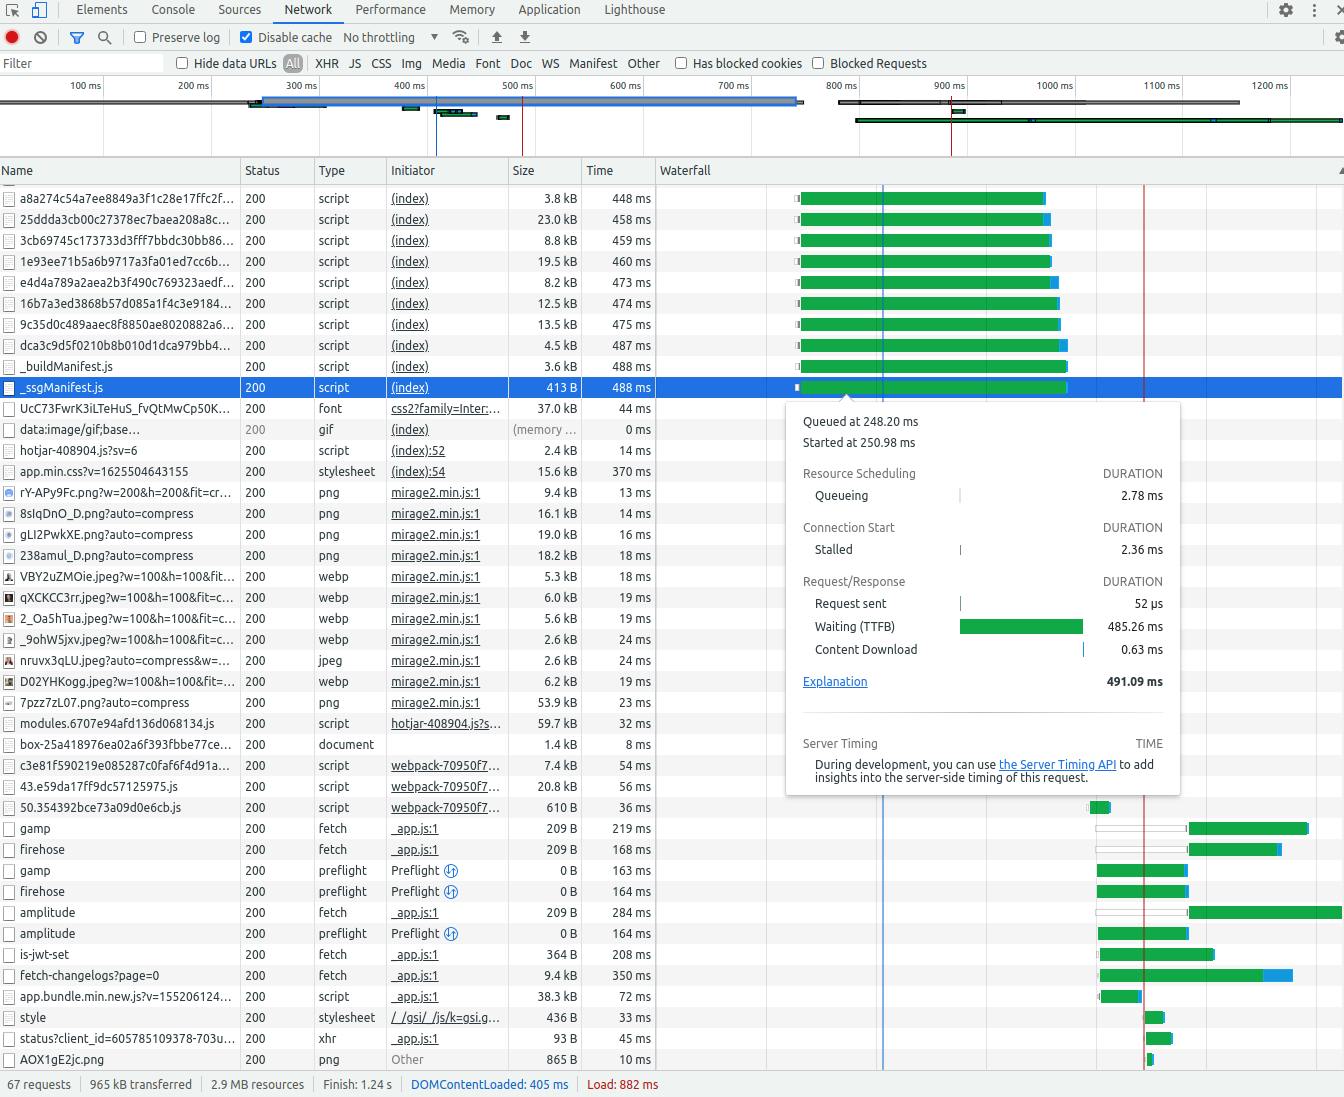
The status bar at the bottom sums up the number of requests, total data transfer (possibly compressed), the total size of all uncompressed resources, the total download time, and the time when the document DOMContentLoaded and window load events were triggered.
More options are provided at the top:
Preserve log: Don’t clear the log between page loads
Disable cache: Load all files from the network to make a better assessment of first-time page access
Throttle network speed: Select or define download speed profiles
You can use Filter to search for requests based on different criteria.
If you want to learn more about the Network Panel, I strongly recommend this video: Inspect Network Activity - Chrome DevTools 101.
Chrome's Performance Monitor 🧶
Chrome’s new Performance Monitor can be found through the DevTools’ More tools sub-menu.
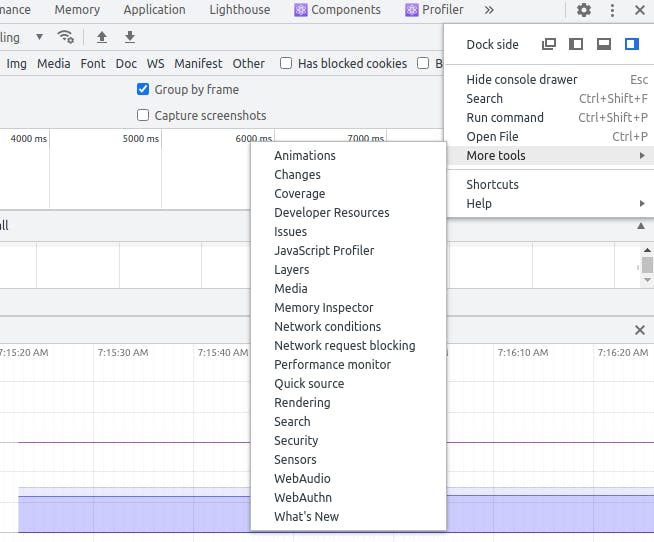
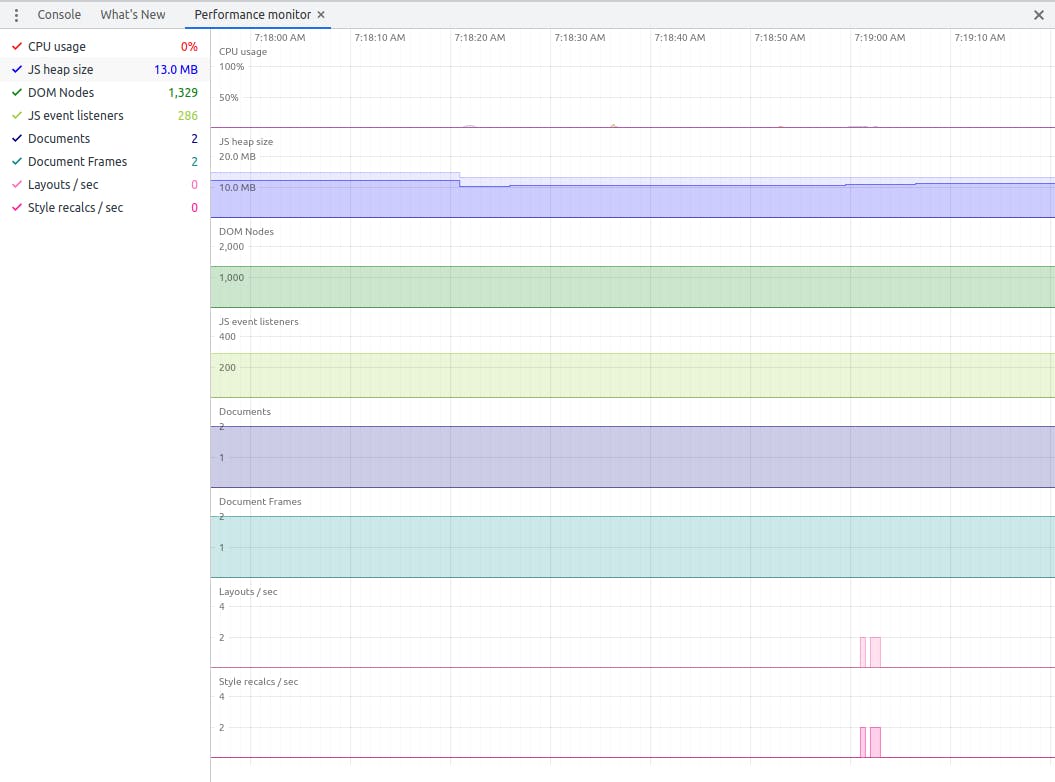
Monitors can be displayed and hidden by clicking the heading on the left:
CPU usage: Processor utilization from 0% to 100%
JS heap size: Memory required for JavaScript objects
DOM Nodes: The number of elements in the HTML document
JS event listeners: The number of registered JavaScript event listeners
Documents: The number of document resources including the page, CSS, JS, etc.
Document Frames: The number of frames, iframes, and worker scripts
Layouts / sec: The rate at which the browser has to re-layout the DOM
Style recalcs / sec: The rate at which the browser has to recalculate styles
The Performance Monitor could be used to find strange spikes during activity (runtime), such as high memory use or layout recalculations when an element has been added to the page.
Further investigation can then be done in the Performance Panel after you have a clue of perhaps what potentially could be the cause of the site not being that performant.
I highly recommend watching this video: Exploring the Frontend Performance of the National Rail Website with Chrome DevTools.
Developer Tools’ Performance Panel ⚡
The developer tools provided in modern browsers provide a Performance tab that allows you to record a snapshot of browser activity when particular operations are made. Unlike the Performance Monitor, you must record a profile before it can be analyzed, this is great in order to find the root cause of the problem.
It is good to keep your records short (0s - 3s), it is gonna be easier to analyze the result.
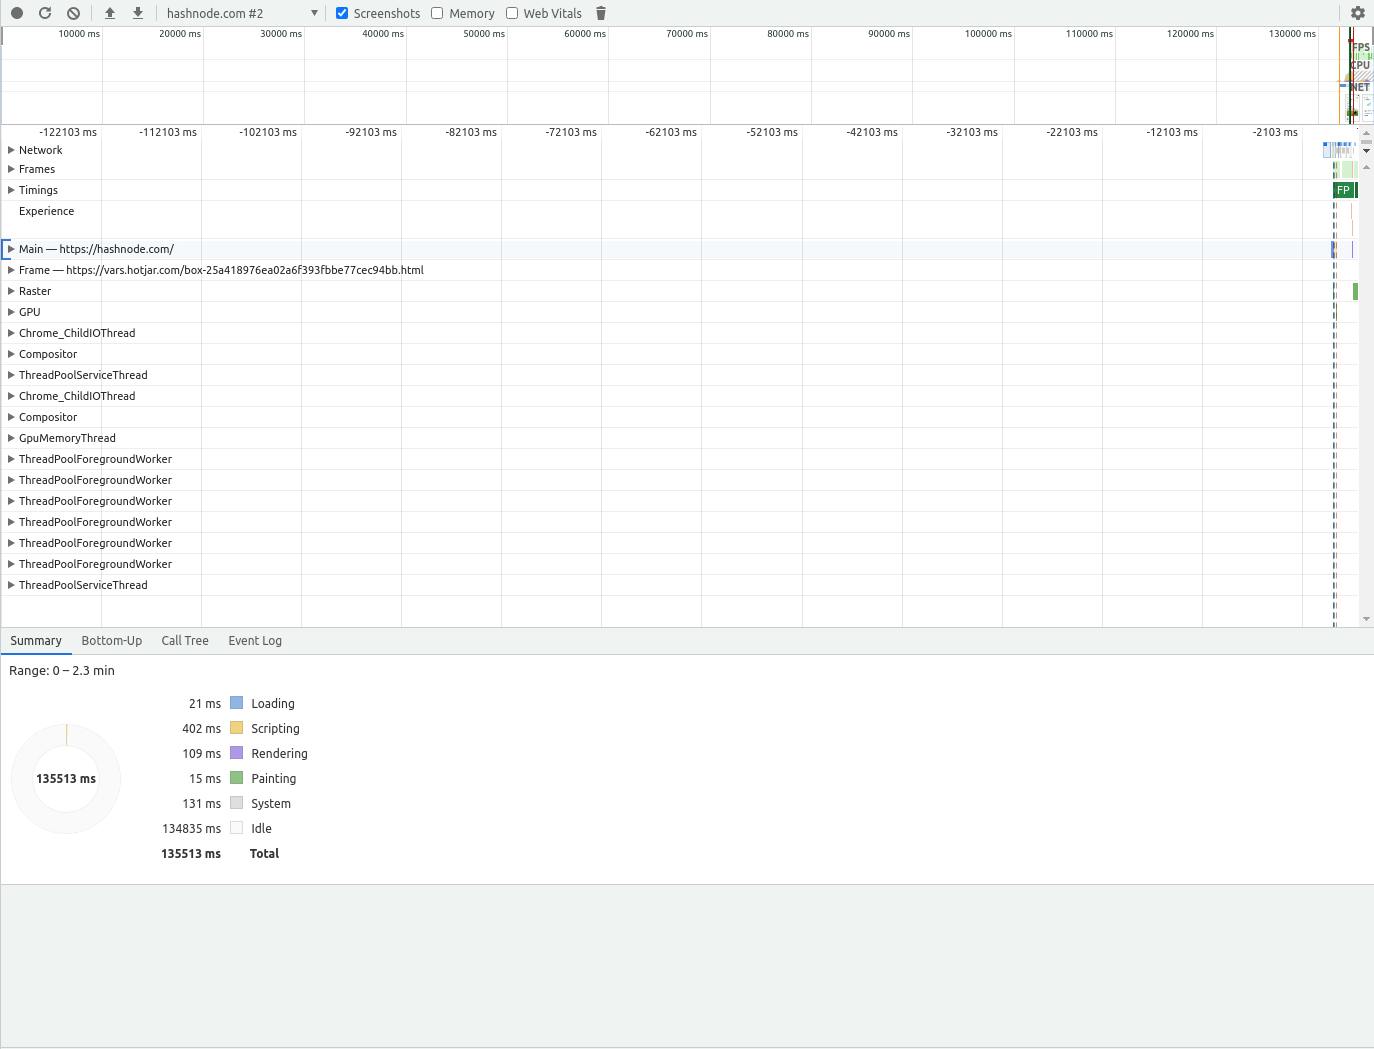
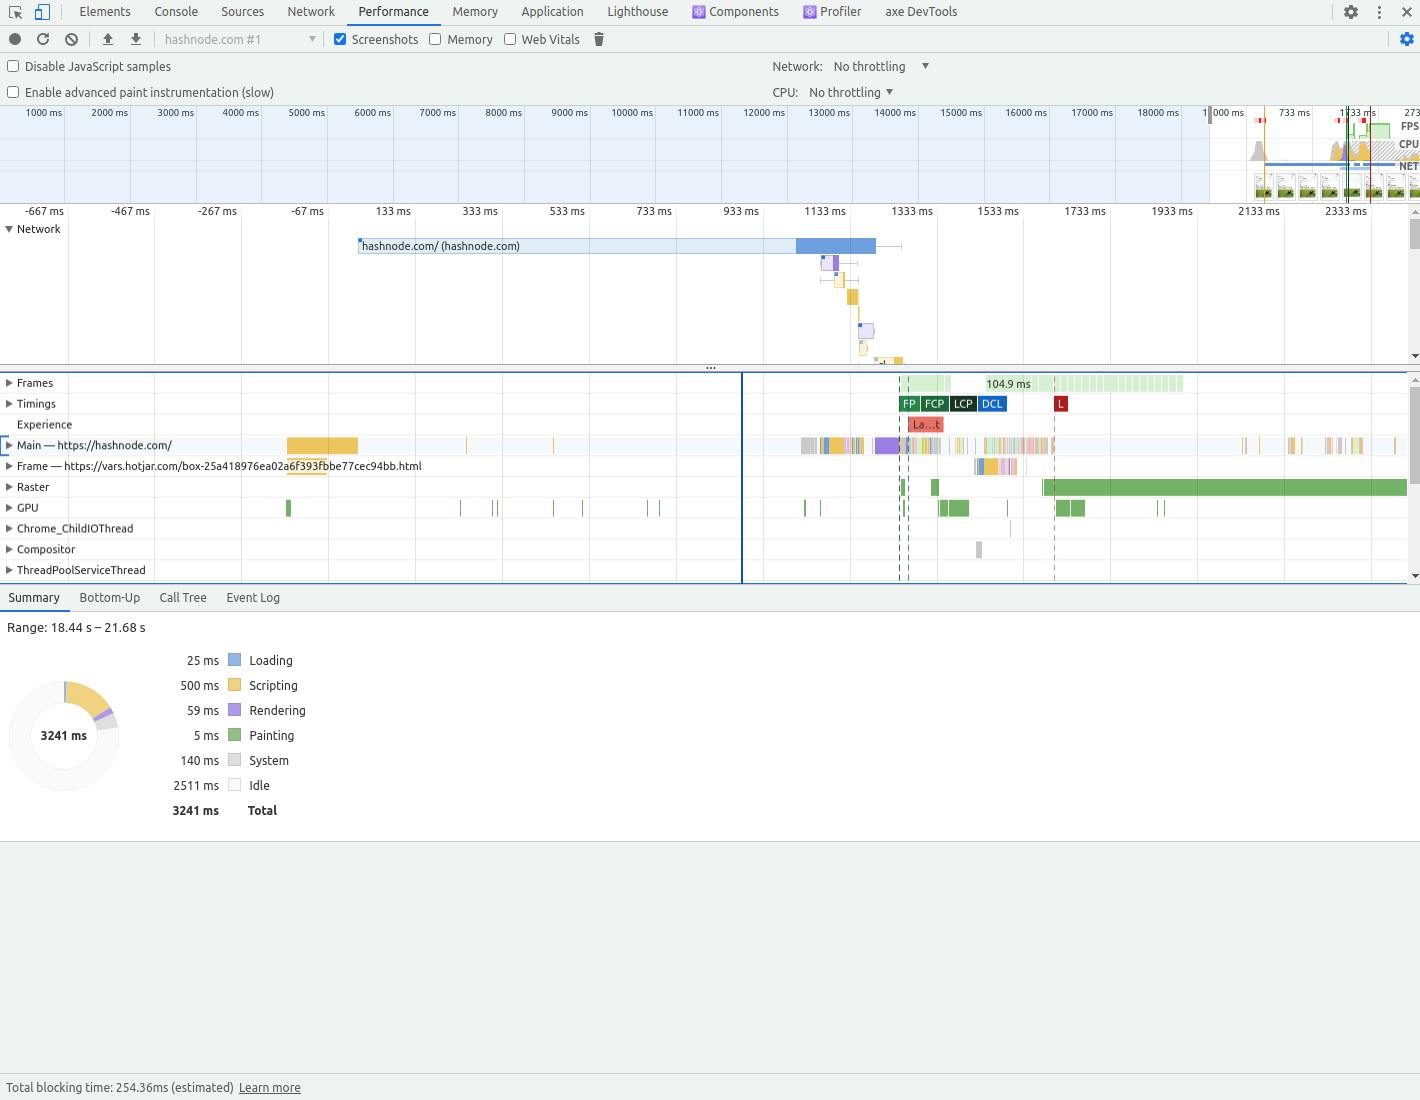
The result panes can be expanded and collapsed, they may differ depending on the version of Chrome, but usually include:
Network: Loading times for individual files
Frames: Screenshots at points on the timeline
Interactions: Input and animation timings
Timings: Events such as DOMContentLoaded and the First Meaningful Paint
Main: Thread activities such as function calls and event handlers
The final Summary panel changes as you click items in the upper panes. The breakdown may include:
Loading: Time to load assets from the network
Scripting: JavaScript execution resulting in visual changes (which can also include CSS animations and transitions)
Rendering: The browser process of calculating which CSS rules apply and how the layout is affected
Painting: The browser process of filling in pixels and drawing layers in the correct order
System: Other browser activities
Idle: No activity
The panel can usually be used to find activities that are inefficient, including:
Expensive event handlers, such as those attached to scroll or mouseover actions
Long-running JavaScript functions
Slow or badly throttled network requests
A continually rising JavaScript Heap, which could result from memory leaks or poor garbage collection
Style changes that affect many DOM elements
If you want to learn more and even see a real-life use-case, I strongly recommend this video: Modern DevTools: Running a performance profile on the YouTube search box.
Also, the DevTools do change from time to time, especially the Chrome one, in order to get up-to-date information, I recommend reading their documentation: Analyze runtime performance.
DevTools Console Logs 💖
In some instances, it may be necessary to profile JavaScript execution by logging messages to the console when events get triggered. Modern browsers support various Performance Timing APIs that can help to analyze code.
performance.now()
performance.now() returns the elapsed time in milliseconds since the page was loaded.
const firstTimestamp = performance.now();
event();
const secondTimestamp = performance.now();
console.log(`event() executed in ${ secondTimestamp - firstTimestamp }ms`);
Performance Marks and Measures
You can also mark when an event occurs and measure the time elapsed between two marks. A mark is defined by passing a name string to performance.mark():
performance.mark('script:start');

performance.mark('event1:start');
event1();
performance.mark('event1:end');

performance.mark('event2:start');
event2();
performance.mark('event2:end');

performance.mark('script:end');
Each mark() call adds a PerformanceMark object to an array, which defines the name and startTime.
A mark can be cleared with performance.clearMarks(markName). All marks are cleared when no name is passed into the function.
The time that has passed between two marks can be calculated by creating a performance.measure() by passing the measure name, start mark, and end mark:
performance.measure('event1', 'event1:start', 'event1:end');
performance.measure('script', 'script:start', 'event1:end');
Each measure() call adds a PerformanceEntry object to the same array, which defines the name, startTime, and duration.
Measures can be cleared with performance.clearMeasures(measureName). All measures are cleared when no name is passed into the function.
Marks and measures can be accessed with:
performance.getEntriesByType(type), where type is either "mark" or "measure"
performance.getEntriesByName(name), where name is a mark or measure name
performance.getEntries(), to access all items in the array.